Empowering Middle Eastern Businesses with Interactive Data Tools
Unlocking the Power of Data Visualization
Explore how Business Central empowers businesses in the Middle East with advanced data visualization tools, enabling them to create interactive charts, graphs, and maps that facilitate informed decision-making and strategic planning.
For businesses in Saudi Arabia, UAE, Riyadh, and Dubai, the ability to visualize data comprehensively can be a game-changer in making informed decisions. Business Central comes equipped with powerful data visualization tools that allow users to transform raw data into interactive charts, graphs, and maps. This capability enables businesses to see patterns, trends, and correlations that might not be obvious in traditional reports, facilitating a deeper understanding of their operational, financial, and customer data.
Enhancing Business Intelligence with Interactive Charts and Graphs
Interactive charts and graphs are at the heart of effective data visualization. Business Central provides a variety of customizable visualization options that allow businesses to tailor their data displays to meet specific needs. Users can choose from bar charts, line graphs, pie charts, and more to represent different types of data dynamically. This flexibility is crucial for businesses in dynamic markets like Dubai and Riyadh, where the ability to quickly adapt and respond to data-driven insights can provide a significant competitive edge.
Leveraging Geographic Data with Integrated Maps
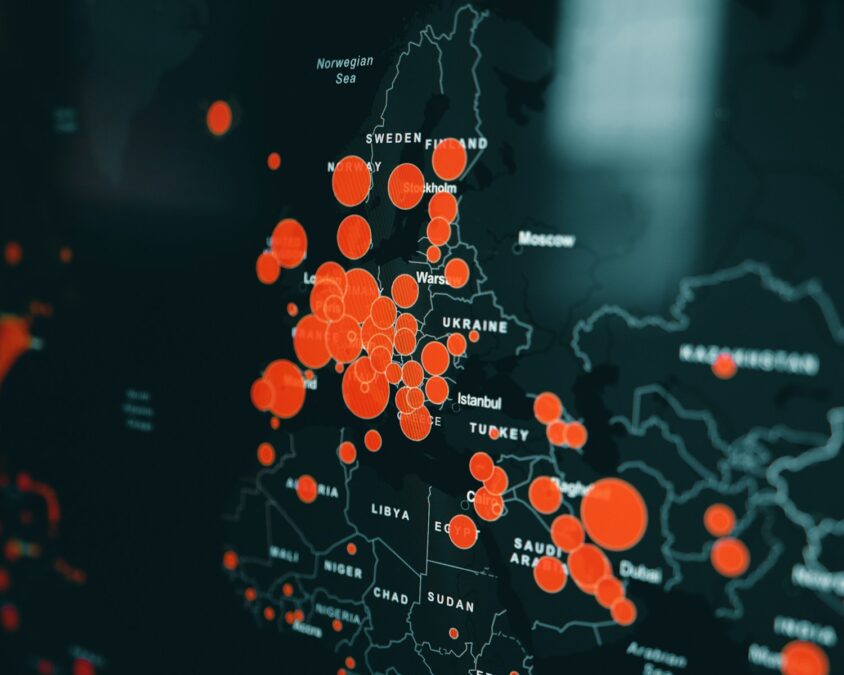
Business Central’s data visualization tools include advanced mapping capabilities, which are essential for businesses operating in geographically diverse regions like the Middle East. These tools allow companies to plot data geographically, making it easier to identify regional trends, optimize logistics, and target marketing efforts more effectively. By integrating geographic data visualization, businesses can enhance their strategic planning and resource allocation, leading to improved operational efficiency and market penetration.
Streamlining Decision-Making Processes
The integration of interactive data visualization tools in Business Central streamlines the decision-making process by providing clear and actionable insights. Executives and managers no longer need to sift through extensive spreadsheets or reports; instead, they can quickly access visual representations of the data that highlight key information and trends. This capability is particularly beneficial in fast-paced business environments like those in Saudi Arabia and the UAE, where rapid and informed decision-making is critical for maintaining business agility.
Customizing Visualizations to Fit Business Needs
Recognizing that no two businesses are alike, Business Central allows for extensive customization of data visualizations. Businesses can configure dashboards that focus on the most relevant metrics, adjusting the aesthetics and types of visualizations to align with their operational focus and corporate style. This customization not only enhances the usability of the visual data but also ensures that the insights generated are directly applicable to specific business challenges and objectives.
Facilitating Team Collaboration Through Shared Visualizations
Business Central enhances team collaboration by allowing multiple users to access and interact with the same visualizations simultaneously. This feature is particularly beneficial for businesses in the Middle East, where cross-departmental collaboration is essential for holistic decision-making. By enabling teams from different departments to view and analyze the same data visualizations, Business Central helps ensure that all stakeholders have a unified understanding of the business insights, fostering more coherent and coordinated strategic actions.
Improving Customer Insights with Data Visualization
Data visualization tools in Business Central also play a crucial role in enhancing customer insights. By visually mapping customer behaviors, preferences, and interactions, businesses can identify patterns and trends that inform more effective marketing strategies and customer service improvements. This capability is invaluable for companies in regions like Dubai and Riyadh, where understanding diverse consumer bases is key to tailoring offerings and services that meet nuanced customer needs, thereby boosting customer satisfaction and loyalty.
Enhancing Operational Transparency with Real-Time Visualization
Business Central’s real-time data visualization capabilities provide businesses with instant visibility into their operations, finances, and customer interactions. This real-time insight is crucial for maintaining operational transparency, enabling immediate responses to potential issues or opportunities as they arise. For businesses in the fast-paced markets of the UAE and Saudi Arabia, the ability to monitor operations and performance in real-time is not just a convenience—it’s a necessity for staying competitive and agile in a rapidly changing business environment.
Preparing for Future Trends with Scalable Tools
As businesses grow and data becomes increasingly complex, the scalability of visualization tools provided by Business Central ensures that businesses can continue to handle larger datasets without performance degradation. Moreover, as the fields of Artificial Intelligence and Machine Learning continue to evolve, Business Central’s visualization tools are designed to integrate with these technologies, providing businesses with not only descriptive but also predictive analytics capabilities. This forward-looking approach is crucial for businesses in the Middle East looking to leverage the latest technological advancements to drive growth and innovation.
-mono-white MH-cropped-h99")