-mono-white MH-cropped-h99")

Empowering Decision-Making through Effective Data Visualization: The Role of Data Visualization in Decision-Making
Introduction
In the realm of business strategy and management, data visualization in decision-making has emerged as a powerful tool for enhancing the quality and effectiveness of business decisions. This article aims to provide business executives, mid-level managers, and entrepreneurs with insights into how data visualization can transform their decision-making process.
The Impact of Data Visualization on Business Decisions
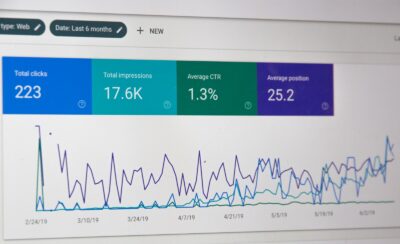
Data visualization has emerged as an indispensable tool for transforming raw data into comprehensible and actionable insights. It involves the graphical or pictorial representation of data, enabling decision-makers to grasp complex concepts, identify patterns, and make data-driven choices with greater clarity and confidence. By translating numerical information into visually engaging formats, data visualization elevates data from mere statistics to a powerful narrative, empowering individuals to extract meaning and make informed decisions.
In today’s data-driven world, businesses, organizations, and individuals are inundated with vast amounts of information. While data holds immense value, its sheer volume and complexity can often obscure critical insights and hinder effective decision-making. Data visualization bridges this gap by transforming raw data into visually compelling representations, allowing the human brain to process, interpret, and extract meaning from information more efficiently.
The power of data visualization lies in its ability to unveil hidden patterns and relationships within data that might not be readily apparent in its numerical form. By employing charts, graphs, maps, and other visual elements, data visualization converts abstract concepts into tangible representations, enabling decision-makers to identify trends, anomalies, and correlations that would otherwise remain hidden. This visual storytelling approach not only enhances understanding but also sparks new perspectives, leading to innovative solutions and informed decision-making.
Data visualization extends its benefits beyond data comprehension; it fosters collaboration and communication. Visual representations of data transcend language barriers and cultural differences, making it a universal language that can be understood and interpreted by people from diverse backgrounds. This shared understanding facilitates effective communication among decision-makers, stakeholders, and team members, ensuring that everyone is aligned on the same page and can contribute meaningfully to data-driven decision-making processes.
In essence, data visualization has revolutionized the way we interact with data. It has transformed data from a mere collection of numbers into a powerful tool for understanding the world around us. By embracing data visualization, businesses can gain a competitive edge, organizations can optimize their operations, and individuals can make informed decisions that shape their lives and communities. As the world continues to generate ever-increasing volumes of data, data visualization will undoubtedly remain an essential tool for navigating the complexities of our data-driven world.
Turning Data into Actionable Insights
The key to successful data visualization lies in its ability to turn large datasets into actionable insights, thereby enabling business leaders to make informed decisions based on clear, visual evidence.
Role in Change Management
Incorporating data visualization in decision-making is a critical component of change management. It allows leaders to identify trends and anticipate the needs of the business, ensuring that strategic changes are data-driven and aligned with business goals.
Navigating Business Transformations
Effective use of data visualization assists leaders in navigating through business transformations and market changes, providing a clear picture of potential outcomes and impacts.
Importance in Executive Coaching and Leadership
For leaders and managers, understanding and utilizing data visualization in decision-making is crucial. Executive coaching programs increasingly focus on enhancing leaders’ abilities to interpret visual data, encouraging a more analytical approach to decision-making.
Developing Data-Driven Leadership Skills
Through executive coaching, leaders learn to appreciate the value of data visualization in crafting strategic decisions, ensuring they are equipped to lead their teams with confidence and clarity.
Enhancing Communication with Data Visualization
Effective communication is essential in conveying complex data and strategic decisions. Data visualization serves as a powerful tool for communicating intricate ideas in a more digestible and understandable format.
Fostering Clarity and Transparency
Utilizing visual data aids in fostering clarity and transparency in communication, ensuring that all team members understand the rationale behind strategic decisions.
Generative AI and Advanced Data Visualization
Generative Artificial Intelligence (AI) is revolutionizing the field of data visualization. AI can process vast amounts of data to create more sophisticated, insightful visual representations that enhance decision-making processes.
AI-Driven Insights for Strategic Planning
Generative AI provides deep insights and predictive analytics, enabling businesses to visualize future trends and scenarios, which is invaluable in strategic planning and risk assessment.
Conclusion
In conclusion, data visualization in decision-making is a critical tool for modern businesses. It not only enhances the decision-making process but also supports effective communication and strategic planning. By leveraging the power of visual data, companies can gain a competitive edge in today’s data-driven business environment.
#DataVisualization, #DecisionMaking, #BusinessStrategy, #AIinBusiness, #LeadershipDevelopment